Language learning models like GPT-3 and the new GPT-4 model are extremely valuable for many use cases. Natural language processing can be used in various contexts, such as generating, translating, summarizing text or question answering.
As a language model, however, it is designed to generate text. Not images, diagrams or other visual content that requires artistic composition. Like, for example, an analytics dashboard. So, how can you use language learning models (LLM) to build powerful analytics applications? Should you even consider using it at all?
The short answer is yes. Because GPT contains so much domain knowledge and context, there are smart ways to leverage this powerful technology, even for machine-to-machine communication.
In this article, we will walk you through a demo of how to create AI-powered dashboards using GPT-3.5 and Cumul.io, and how you can adjust or build similar scripts for your specific analytics use case!
From our experience of working with +250 SaaS customers who create dashboards day in day out, we learned that one of the main challenges is to decide what to visualize on a dashboard. Which information is interesting to your business or to your product users?
There are different ways to uncover that business knowledge.
Or, you can save yourself loads of time, and use GPT. GPT can inject all the contextual information you need into your process of figuring out what to visualize, based on what it knows through language processing.
In this article, you’ll walk through a demo that auto-generates dashboards using GPT-3 and Cumul.io’s embedded analytics platform. To follow along, simply clone our GPT dashboard generation repo on GitHub.
The goal of this script is to create an automated dashboard based on any dataset you already have available. OpenAI will function as an “insights miner” to tell you what’s interesting to visualize, and how to visualize it. We’ll then return its output to Cumul.io’s API to automatically create AI-powered dashboards on top of it.
Cumul.io’s API-first platform allows you to use technologies like OpenAI’s GPT-3 and GPT-4 on top of our platform, simply by letting the two APIs communicate.
The demo in this article is just a simple example of the possibilities this opens up to build strong applications with AI.
Below, we’ll walk through the code in detail. Want to get started immediately? Watch this short video, and get this project up and running in just a few minutes!
In short, this tutorial will discuss a script that automatically generates an AI dashboard in three simple steps.
Now that you know what the end result will be, let’s walk through the demo in more detail.
Before you can get started, you will need:
For this demo, we’re using the Airlines Customer Satisfaction dataset from Kaggle.
Before you can start retrieving any datasets, you’ll want to make a connection with the OpenAI and Cumul.io APIs, and connect the two of them together.
The code snippet below will do exactly that.
If you haven’t worked with Cumul.io and/or OpenAI before, you’ll also need to create an API key for both platforms. For more information, check out the relevant developer docs.
Now that you’ve set up a connection, you’ll run the following snippet to retrieve your datasets. This code retrieves every new dataset in your Cumul.io account since the last time you ran it. It will initialize with all your existing sets on the first run only, so only sets added while running the code will be considered.
Now, you’ve retrieved the dataset name, id, and all the columns included in each dataset. Once you start this script, it will keep listening to new datasets as you add them to your account.
You can modify this code to your liking. For example, you could edit the script and only retrieve one specific dataset.
First, you’ll perform an API call to OpenAI in order to input a prompt into the system, just like you would type a prompt in ChatGPT.
This snippet includes a couple of parameters to shape our request, for example:
The code for the prompt will eventually look like this.
Now, let’s discuss the code for this prompt in more detail.
Generating a useful prompt is the biggest challenge here, since GPT-3 is a language model, and we want to generate a piece of structured data that our API can understand.
The clue here is to do two things.
The technology has a fairly good understanding of what JSON looks like in terms of its text model. This improves our chances of having an output our API can work with.
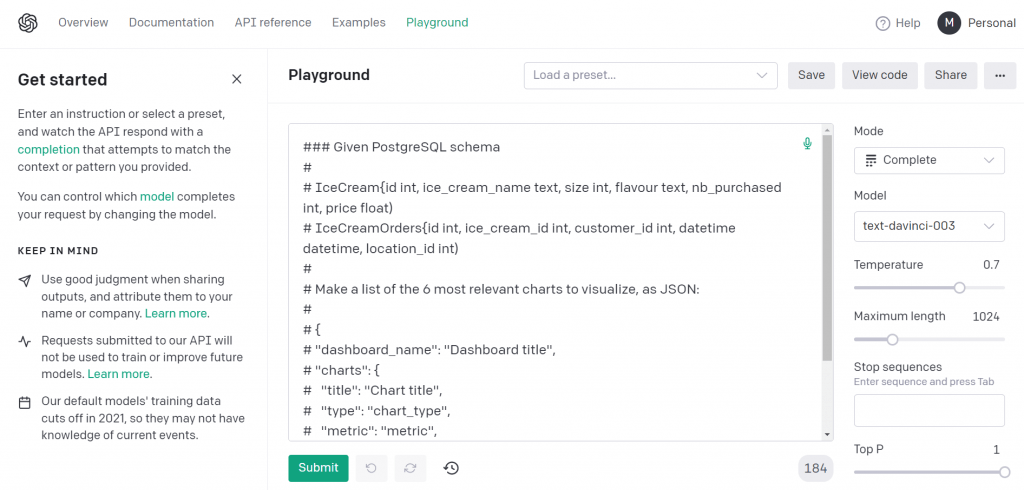
If you were to enter the prompt directly into the OpenAI playground, it would look like this.

With this prompt, chances are already realistic you’ll get valid JSON in response. However, keep in mind that GPT-3 is a language model. It doesn’t know what valid JSON is, and will simply generate something similar to JSON. That means it will generate different JSON every time you run this script.
So how do we make sure OpenAI generates JSON in our desired format?
If you’ve worked with ChatGPT or OpenAI before, you know your output gets better as you refine your prompt with more context. So to solve this challenge, we will add the structure of our JSON file to the prompt.
The prompt now looks like this.
This prompt is an example of a one-shot approach vs. the zero-shot approach we tried first.
You can now send the prompt to OpenAI.
When the response comes back from OpenAI, you can try to parse the output as JSON.
You may need to play around with the script and run it few times before ending up with a valid JSON. Below is the code to parse the JSON.
💡Pro tip. We recommend logging your API calls. By logging all prompts and responses, you can debug more easily afterwards. You can do this by adding the following snippet of code.
When you’ve parsed the JSON successfully, you can use Cumul.io’s dashboard builder SDK. This SDK is useful because it builds dashboards through function calls, so you can easily generate AI-powered dashboards via code based on a JSON file.
The code snippet below will do the following actions.
💡Note. In our initial prompt, we did not include which chart types are available in Cumul.io. We’ve added a function to this code that will find the best chart match, based on the type of chart OpenAI has chosen. You can also choose to suggest the available chart types in your prompt instead… and hope GPT will follow your lead.
And that’s it! You’ve now successfully created an AI-powered dashboard from scratch using only a dataset, OpenAI and Cumul.io. Below, we've embedded one of our resulting dashboards, but we encourage you to try it yourself!
The script explained in this tutorial is simply an example of what is possible when hooking up the two APIs. Once you know how it works, a wealth of options become available. Here are a few recommendations of how you could expand on the code.
You can play around with the prompt to personalize the resulting AI-powered dashboards. For example, ask for the 6 most relevant charts for an airline support rep vs an airline executive member.
Tell the prompt you want to use a mix of data visualizations. You can also add a fixed template in the composition layer of your code, which defines where to place certain chart types, interactive filters etc. in your dashboard. It will make data visualizations with AI even more powerful!
We built this example on the Da Vinci model, but you can also use other models like GPT-4.
In this example, we’ve used a one-shot approach. You can also use embeddings to add a lot more contextual information, like information about dashboards you already have, or adding anonymized dashboard structures. With this input, OpenAI can work with training data to generate better, more complete dashboards.
Want to get started using OpenAI and Cumul.io? We’ve assembled a list of resources that will help you.
Cumul.io Documentation
OpenAI Developer documentation

