Designing a fancy and insightful dashboard in Cumul.io is an easy job. Now, what’s the next step? Once your dashboard is ready, of course you’ll want to share it with the right people. You might want to plug it in your company’s platform, or showcase it on your website. Or even better: you want to offer analytics to your customers within your own app, styled to your own company’s look and feel!

Luckily, our platform is built for integration. In this post, we’ll walk you through every step of the process to integrate a dashboard in your website, app or platform. In that way, you can offer integrated analytics to your customers.
Generally, we distinguish between dashboard embedding and dashboard integration:
In this integrated dashboard tutorial, we’ll discuss both how to embed & how to integrate a dashboard in your platform. Let’s start already!
You can embed a dashboard in one simple step. Simply add the embed code to your website or app. To start with, we need the following 2 things:
For convenience, you can download all the files which we’ll use in this tutorial. Start by downloading and extracting the zip file. It includes a backend folder, a frontend folder and also the .csv dataset we’ll use for our dashboard.
Logically, we’ll need to create a dashboard first, before we can embed it. For the dashboard we’ll use a demo dataset 'demo_orders.csv'. It contains data about the customers of a fictional shop, and the orders they placed. I created a demo dashboard on this dataset for you to use as inspiration.
To follow along with this integrated dashboard tutorial, upload the demo_orders.csv set in your Cumul.io account. Then, recreate the dashboard in your own Cumul.io account. If you want to get familiar with our dashboard editor, you can have a look at our Academy!
Of course, feel free to build another dashboard using your own data, or use one of your existing dashboards for this tutorial!
Next, let’s prepare the dashboard for embedding. In the dashboard overview page, search for the dashboard you want to embed. Click the share icon and navigate to the ’embed’ tab in the modal.
You will see 2 toggles to:

After enabling the toggles, Cumul.io will automatically generate the code we’ll use to embed the dashboard in your website. For more information on what this code exactly does and contains, you can have a look at our developer documentation.
Please note that if you’re on a plan that allows integration (or on a free trial), there will be an ‘integration’ tab instead of an ’embed’ tab. The integration code is nearly the same as for embedding. However, it has 2 added fields: key and token, which you can simply leave out for embedding.
Next, we will build a small example website to embed our dashboard in. You can take a look at the already finished index.html file in the frontend folder of the downloadable zip file. Or, just follow along with building it.
We’ll begin by defining the structure of our HTML file.
Three files are loaded at the top of the page. Firstly, it loads bootstrap CSS for styling. Secondly, we’ll add some extra custom styling to main.css. This makes our website a bit more appealing. Finally, the cumulio.min.js file is included, our integration API, which allows secure rendering of the dashboard. Next, let’s take a look at the completed index.html file.
The actual dashboard embedding starts at line 27 of the above code snippet. First, it calls the addDashboard function. This function loads and renders the dashboard with the specified id in the specified HTML div (my-dashboard-104 in this case). In this function, you’ll need to change the dashboardId to your own dashboard id. In the addDashboard function, the loader style is also set. This is fully optional. You can use it to visually smoothen the loading. You can read a full specification of all possible parameters for this function in the developer documentation. That’s it! We have embedded a Cumul.io dashboard in our website using only 10 lines of code. Now it’s time to take a look at the result.
First, simply go to the folder where you extracted the zip file, go to the frontend folder and right-click the index.html file to open it in your browser.

The resulting website, with the embedded dashboard in it, will look like this.

You can use the filter item in the top-left of the dashboard to (de)select a certain customer. That way, the dashboard will only show data about the selected customers.
While this is already great, you can go one step further. You can build a log-in system or user selection tool around it. That means a customer can securely log in to the website and view the dashboard. Then, this will automatically filter to contain only his or her data. There is no way to view data from other customers. Using this method, you can create secure and personalized integrated analytics for your platform.
For this, we will need a second, server-side step: requesting authorization tokens for the dashboard and dataset(s) and specifying the filter(s). This brings us to dashboard integration.
Besides including the embed code in your website or app, dashboard integration also needs a server-side step. In that step, we request an authorization key and token, using the Cumul.io API.
This step has to be done on the server-side for security. If we would request the authorization token from the front-end, users could manipulate this request and view data of other users. Now, your back-end will decide who has access to the data!
In this section, we will be building a small app which uses integrated analytics.
Let’s begin with implementing this server-side step. In this tutorial, we’ll use NodeJS for our server. However, this doesn’t mean you can only use Cumul.io in NodeJS applications. You can for example also use our PHP SDK, C# SDK or Java SDK.
We will need a very simple webserver (webserver.js) that listens to requests made by our front-end. We’ll also need a second, main file (index.js) that uses this webserver, and requests a Cumul.io authorization key and token with the correct filters. It will then return the key and token to our front-end, where we can use it for integrating the dashboard. You can find both files in the zip file.
To start, you only need 2 things:
Verify in a terminal that node and npm (node’s package manager) are installed correctly.

We will be using the following libraries to build our webserver.
The backend folder of the zip file already includes a package.json file. So, you can install all required libraries by going to the backend folder in your terminal and then using npm.
To be able to use the Cumul.io Node SDK, you first need to create an API key and token in your Cumul.io profile settings. Next, modify the .env file so that it uses your newly generated Cumul.io API key and token in the file.
Our webserver file, webserver.js, looks like this.
The zip file also includes the webserver.js file, and is now ready for use.
Next up, we’ll create a file index.js that uses our webserver and can process a basic get request. It uses the Cumul.io Node SDK to request an authorization key & token for our dashboard and dataset. Here, the Cumul.io API key and token you created are first read from the .env file. We will also add an extra field filters to our API call. This will ensure that the dashboard is personalized for the user who views the dashboard. The value of the filter will be passed from the front-end of our application. More information about filter types and adding filters in authorization token requests can be found in our developer documentation.
A few notes about the parameters in the client.create API call:
You will need to change the securables, securable_id and column_id of the above code example to use the id’s of your own dashboard, dataset and column. You can find these id’s in the platform itself. Our developer documentation shows where you can find the dashboard id, dataset id and column id. Once you use your correct id’s, our server-side implementation is now ready to be called from the client-side of our application!
We’ll continue building on the small example website we made for dashboard embedding, and use the earlier HTML code as a base. You can find the finished index-integration.html file in the frontend folder of the downloadable zip file, or you can follow along with the steps below. We will make quite some changes to the original HTML code of our website. Most importantly, we’ll build a user selection menu on top of our website. Here, a user of the app can choose a customer name to filter the dashboard on. In this selection menu, we’ll include six example names from the tutorial_orders dataset. In your own app or platform, you would ideally add password security to this user selection system, but adding that here would be outside the scope of this tutorial. So for now, you can select a user just by clicking his or her picture, which will look like this.

Next up, we’ll make some changes to the JavaScript code of our app. In the earlier embedding example, we only called the addDashboard function. We will now add a login and logout function to this. The login function will fire a request to the server we just developed, which runs on localhost:3030. The server will then request the authorization key and token from the Cumul.io API, and return those to the front-end. We will pass along the selected name in the request, so that it filters the dashboard and the underlying dataset to only contain data about the selected user. The login function will also hide the user selection menu. The logout function uses the removeDashboard function of the Cumul.io Integration API to safely remove the dashboard. After that, it will show the user selection menu again. Let’s take a look at the complete, adapted HTML file.
Once again, in the Cumulio.addDashboard function, you’ll need to change the dashboardId to your own dashboard id. The actual integration happens in the highlighted lines 71-89: it uses the returned authorization key and token in the Cumulio.addDashboard function to securely render the filtered dashboard.

To summarize, these are the files you should have right now in your folder. index.js and webserver.js together form our back-end, which we’ll call to return authorization tokens for the dashboard. index-integration.html is the front-end of our integrated analytics application. Now, it’s time to spin up our server and take a look at the result! Open a terminal and go to the backend folder of our application. Start the server with the following command.
Our server is now listening for requests.

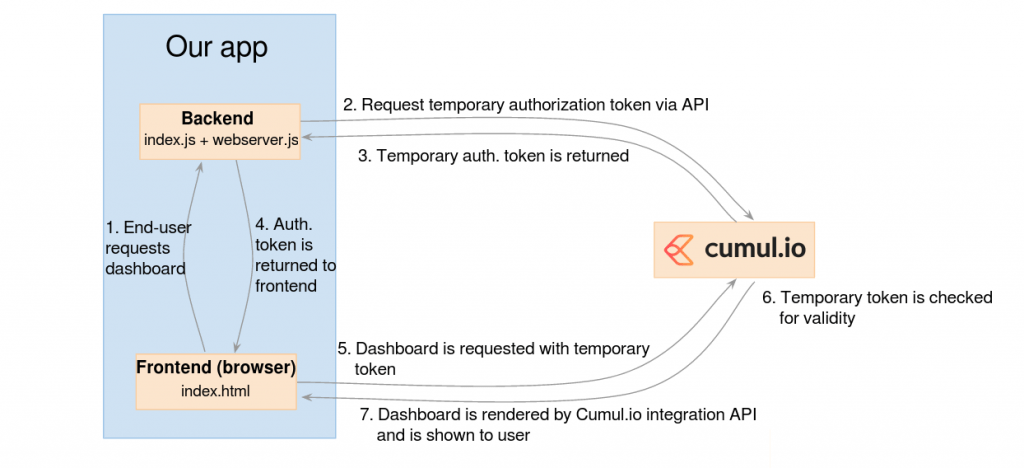
Next, from the frontend folder, open the index-integration.html file in any web browser. Initially, you will see the user selection menu. Clicking a user picture calls the login function. It passes the clicked name as a parameter. Once you click one of the six pictures, this activates the integration flow. The login function calls our server, with the selected name contained in the request. Our server makes a request to the Cumul.io API for an authorization key & token, containing a filter on the selected customer name. Then, it returns the authorization key & token to our front-end. Finally, it uses the addDashboard function of the Cumul.io Integration API to securely render our dashboard in the website, containing the filtered data for the selected customer. We can visualize the flow of our app as follows.
If we, for example, select Chad Greenfelder from the drop-down, the result will look like this.

Let’s compare the above example to the original embedding example in the beginning of this blogpost. There, the user could select and view data of any customer in the dataset. Now, in our securely integrated example, the filter ensures that the dashboard contains only data of the selected user. That’s it! You’ve built a website containing an embedded dashboard, as well as a mini-app with a secure dashboard integration. Now sit back, relax, and play around with your beautiful dashboards.
Both dashboard embedding & dashboard integration have their advantages and disadvantages. Your choice will depend on your specific use case. As you saw, you can embed a dashboard in an existing webpage in just 10 lines of code. The setup is fast and super-easy. However, anyone who has the URL of that webpage can view the dashboard. This approach is perfect when you’re working with open data – for example the Statbel portal – but might not be ideal when dealing with very sensitive data. In that case, a dashboard integration is a perfect match. For the sake of simplicity of this blogpost, we built a selection menu to select a user. If you would build a secure password-based log-in system around this instead, this would allow highly secure and personalized analytics for your platform! Would you like to learn more about integrated analytics for your platform? Just let us know, we’re happy to help you move forward!

